-
Quick Stats Q2 2014 Q-o-Q Y-o-Y Availability Rate(%) 2.8 ↓ ↓ The arrows are trend indicator over the specified time period and do not represent a positive or negative value. (e.g., net absorption could be negative, but still represent a positive trend over a specified period.)
Hot Topics - The overall vacancy rate has decrease 20 bps since Q4 2013, reaching 2.8%
- Calgary retail sales rose 7.7% over the last 12 months.
- Population growth , rising incomes and inflation are fueling retail sales
- Supply constraints continue to challenge retailers seeking quality space.
*WTI Spot Price as of june 25,2014
(Source: Bloomberg, 2014)
**Source: Conference Board of Canada,
2014, - Calgary’s retail market continued to outperform other Canadian centres over the first half of 2014, fueled by record in-migration, low unemployment and a young population with high disposableincomes.
In response to these favorable fundamentals there has been little reprieve in the strong interest from local, national and international retailers seeking high-quality space, while the supply-side of the equation struggles to keep pace. We would add the caveat that U.S. retailers are moving forward with a greater degree of caution.
There is currently more than 12 million sq. ft. worth of projects either in the planning stage or currently under construction, though it remains to be seen how quickly, and how much ofthis space will be delivered to market.
Compared to six months ago, the overall retail vacancy rate for Calgary declined 20 basis points (bps) to 2.8%. Despite the overall drop in vacancy, new supply acted as a catalyst for rising vacancy rates in the Central Business District (CBD), the North Central submarket and Northwest submarket.
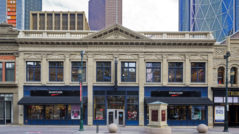
The North Central vacancy rate increased 140 bps to 3.0%. The lift in vacancy occurred primarily in the shopping centres around Centre St. In the CBD, a rise in vacancy for street-front shops contributed to a 100 bps lift in vacancy from six months ago to 7.7%. The rise in street-front vacancy is also indicative of some of the challenges faced by retailers with a street-front location in or around the city centre who struggle to compete with the popularity of power centres and shopping centres.
Additional square footage was added to the South Central submarket through the completion of the retail component of mixed-use projects in urban residential areas, while the Southeast grew on the back of additional power centres.
Regional shopping centres registered a 90 bps escalation in vacancy to 1.4% compared to the end of 2013. Conversely, power centres as a whole recorded a 20 bps decline in vacancy to 0.7%. Community centres saw vacancy drop 10 bps to 2.2% while the corresponding fall for neighborhood centres was110 bps, driving the rate down to 2.5%.
Figure 1:Vacancy Trends by Submarket
Source CBRE Research, Q2 2014
Figure 2: Retail Market Statistics
| Q2 2014 | |||||||||
| Trade Area | CBD | EAST | NC | NW | SC | SE | South | West | Total |
|---|---|---|---|---|---|---|---|---|---|
| Retail Total | |||||||||
| Total Rentable Area (sq. ft.) | 4,004,008 | 5,099,931 | 1,827,557 | 5,904,464 | 9,070,260 | 3,300,142 | 1,818,239 | 2,109,864 | 33,044,465 |
| Total Vacant Area (sq. ft.) | 305,410 | 160,702 | 62,324 | 80,545 | 230,500 | 20,880 | 20,8804 | 26,354 | 907,595 |
| Percentage Vacant(%) | 7.63 | 3.15 | 3.41 | 1.36 | 2.54 | 0.63 | 1.15 | 1.30 | 2.75 |
| Beltline St. Front | |||||||||
| Total Rentable Area(sq.ft.) | 1,548,973 | – | – | – | – | – | – | – | 1,548,973 |
| Total Vacan Area(sq. ft.) | 108,745 | – | – | – | – | – | – | – | 108,745 |
| Percentage Vacant(sq. ft.) | 7.02 | – | – | – | – | – | – | – | 7.02 |
| Downtown St. Front | |||||||||
| Total Rentable Area(sq.ft.) | 1,162,143 | – | – | – | – | – | – | – | 1,162,143 |
| Total Vacant Area(sq. ft.) | 66,576 | – | – | – | – | – | – | – | 66,576 |
| Percentage Vacant(sq. ft.) | 5.73 | – | – | – | – | – | – | – | 5.73 |
| Downtown St. Front | |||||||||
| Total Rentable Area(sq.ft.) | 1,061,709 | – | – | – | – | – | – | – | 1,061,709 |
| Total Vacan Area(sq. ft.) | 120,456 | – | – | – | – | – | – | – | 120,456 |
| Percentage Vacant(sq. ft.) | 11.35 | – | – | – | – | – | – | – | 11.35 |
| Small Retail | |||||||||
| Total Rentable Area(sq.ft.) | – | 712,774 | 405,321 | 511,049 | 1,301,116 | 153,153 | 69,870 | 401,194 | 3,554,477 |
| Total Vacant Area(sq. ft.) | – | 46,638 | 25,629 | 14,453 | 95,505 | 27,980 | – | 1,076 | 209,281 |
| Percentage Vacant(sq. ft.) | – | 6.54 | 6.32 | 2.44 | 7.34 | 18.27 | 0.00 | 0.27 | 5.89 |
| Neighbourhood Shopping Centre | |||||||||
| Total Rentable Area(sq.ft.) | – | 1,703,985 | 470,922 | 697,714 | 2,162,972 | 961,827 | 353,275 | 768,339 | 7,119,034 |
| Total Vacant Area(sq. ft.) | – | 73,797 | 6,759 | 7,855 | 62,698 | 8,501 | 5,835 | 8,272 | 173,717 |
| Percentage Vacant(sq. ft.) | – | 4.33 | 1.44 | 1.13 | 2.90 | 0.88 | 1.65 | 1.08 | 2.44 |
| Community Shopping Centre | |||||||||
| Total Rentable Area(sq.ft.) | – | 809,283 | 608,520 | 891,580 | 703,938 | 79,530 | 93,591 | 507,727 | 3,694,169 |
| Total Vacan Area(sq. ft.) | – | 14,286 | 9,281 | 13,280 | 7,367 | 15,392 | 4,101 | 17,006 | 80,713 |
| Percentage Vacant(sq. ft.) | – | 1.77 | 1.53 | 1.49 | 1.05 | 19.35 | 4.38 | 3.35 | 2.18 |
| Regional Center | |||||||||
| Total Rentable Area(sq.ft.) | – | 1,361,212 | 134,141 | 3,139,448 | 955,514 | – | – | – | 5,590,315 |
| Total Vacan Area(sq. ft.) | – | 15,399 | 3,275 | 42,448 | 11,000 | – | – | – | 72,122 |
| Percentage Vacant(sq. ft.) | – | 1.13 | 2.44 | 0.22 | 0.40 | – | – | – | 1.29 |
Figure 3: Significant Projects
| Size | ||||
|---|---|---|---|---|
| Project Name | Address | sq. ft. | Expected Completion | Developer |
| McCall Landing | Metis Tr. & Airport | 400,000 | Q2 2015 | Trinity Development Group |
| Mahogany Urban Village | Hwy. 22 & 52nd St. SE | 208,000 | Q4 2015 | Hopewell Development Ltd. |
| Gates of Nolan Hill | Nolan Hill Bldvd. & Nolan Hill Dr. | 92,000 | 2016 | Royop Development Corp. |
| Stonegate Common | Metis Trail NE & 128 Ave NE | 195,000 | 2016 | WAM |
| Bringham Crossing | Range Rd. 33 & TWP Rd. 250 | 270,000 | 2017 | Rencor Developments |
| Sage Hill Crossing | 35 Sage Hill Gate | 226,048 | TBD. | Genesis Land Development |
| Seton | Deerfoot Trail & Highways 22x | 130,000 | TBD. | Brookfield Residential |
| Bayside Village: Pahse 2 | 903 Bayside Drive, Airdie | 11,800 | Q1 2015 | Barry Development |
Source: CBRE Research, Q2 2014.
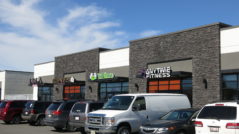
Suburban power centres and regional shopping centres located on the periphery represent a large portion of the supply pipeline. These projects include Seton, Sage Hill Crossing and Stonegate Common.
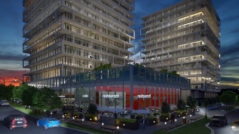
In addition to growth on the city fringe, there are examples of higher-density retail development aimed at capitalizing on residential projects closer to the city centre. The East Village, Eau Claire and the west side of downtown Calgary are all areas which will experience robust population booms, resulting in corresponding residential developments that will further boost the neighborhoods’ populations. Despite being several years away from coming to fruition, the East Village is well-positioned to become a hub for retail, underpinned by both public and private expenditure. RioCan has plans to open a shopping centre in the area with a 2017 launch targeted.
On the other side of the city centre, WAM have announced plans for a residential condo development on the site of the Metro Ford Dealership. It will offer 90,000 sq. ft. of retail space spread over the first and second floors.
Other notable mixed-use projects include Currie Barracks, with current plans to incorporate 225,000 sq. ft. of retail space. Moving further out, the combination of the RioCan/Tanger outlet development and phase one of Bingham Crossing will offer Calgary’s West side over 275,000 sq. ft. of retail space. Phase 1 of Bayside Village in Airdrie is completed and therefore phase 2 of the project has been approved by Barry Development.
Deerfoot Mall’s redevelopment plans call for a phased redevelopment that will see an additional 500,000 sq. ft. added to the centre which will bring the mall’s total size to 1.2 million sq. ft. The centre’s owner, Shape Properties, is aiming to create an open-air regional power centre. Shape has announced that Cabela’s will be opening its first Calgary store at the mall next fall.
Figure 4: Net Asking Rental Range by Retail Format
Figure 5: Per-Capita Retail Sales & Disposable Income
Source Conference Board of Canada & CBRE Research, Q2 2014
Calgary’s economy continues to grow at a faster pace than any other Canadian city. Calgary also boasts the highest-paid workforce, as reflected in significantly above-average disposable income and corresponding purchasing power.
According to the Government of Alberta, the province’s retail sales grew 7.6% year-over-year by May 2014. Alberta’s growth in purchases compared favorably to the national growth of 3.9% and positioned Alberta as the province with the fastest-expanding retail sector.
In Q2 2014, the Conference Board of Canada recorded Calgary’s average personal disposable income at $42,500; 37.0% higher than the national average of $31,021.
Calgary’s above-average disposable income is a catalyst for robust consumer spending; however, in-migration, a young population and inflation are also major contributors to above-average retail sales.
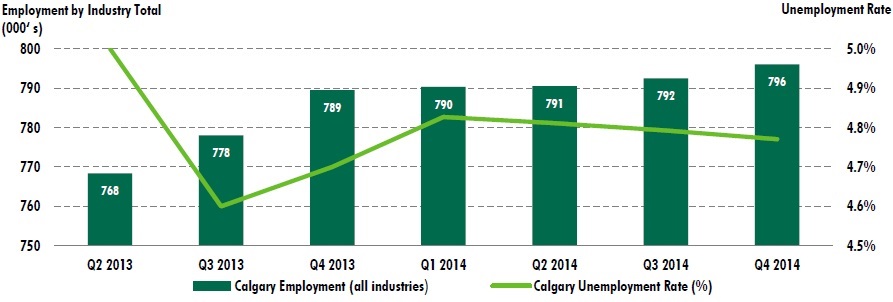
Figure 6: Employment (all industries) & Unemployment Rate – Calgary
Source Conference Board of Canada & CBRE Research, Q2 2014
Alberta’s seasonally-adjusted unemployment rate was 4.6% in May 2014, 20 bps below where it was one year before. Alberta’s unemployment rate remains well-below the national average of 7.0%.
Over the same period, Calgary’s labour force has grown 3.2%, driven by 71,200 new jobs. To put this into perspective, the province of Alberta has accounted for about 85.0% of Canada’s new jobs over the last year.
SUBMARKET MAP
CONTACTS
Jeffrey HurrenSenior Research Analyst
CBRE Limited
500, 530 – 8th Ave.
Calgary, Alberta T2P 3S8 t: +1 403 750 0519
e: jeffrey.hurren@cbre.com
This report was prepared by the CBRE Canada Research Team which forms part of CBRE Global Research and Consulting – a network of preeminent researchers and consultants who collaborate to provide real estate market research, econometric forecasting and consulting solutions to real estate investors and occupiers around the globe
Information contained herein, including projections, has been obtained from sources believed to be reliable. While we do not doubt its accuracy, we have not verified it and make no guarantee, warranty or representation about it. It is your responsibility to confirm independently its accuracy and completeness. This information is presented exclusively for use by CBRE clients and professionals and all rights to the material are reserved and cannot be reproduced without prior written permission of CBRE.


